You have /5 articles left.
Sign up for a free account or log in.

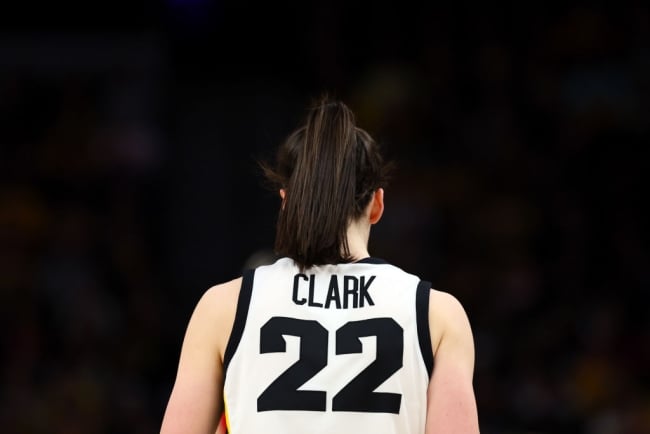
Caitlin Clark, who plays for the University of Iowa, has catalyzed renewed fandom for women’s college basketball.
Adam Bettcher/Getty Images
The women’s NCAA basketball tournament is kicking off this year with a bang; the Big Ten championship on March 10 was the most-watched women’s college basketball game on CBS since 1999. The game, between the University of Iowa and the University of Nebraska–Lincoln, also had the highest viewership of any basketball game aired that Sunday.
Caitlin Clark, a star player for the Iowa Hawkeyes who has already broken more records and won more honors than we have room to name, seemed to drive that surge in viewership. She’s not the only women’s college basketball star who has garnered a huge following in recent years; Louisiana State University’s Angel Reese, for example, became a household name last season as the star player on the championship-winning team.
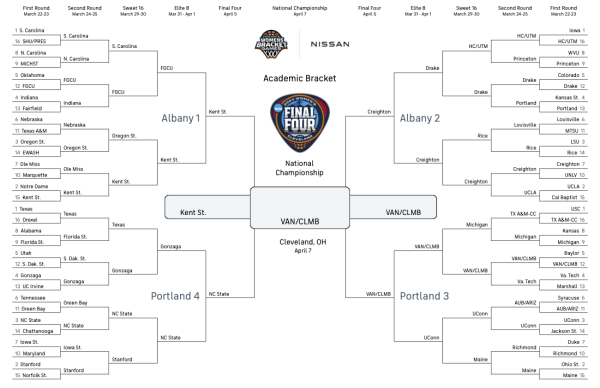
As millions of fans—old and new—gear up for this year’s March Madness, Inside Higher Ed is celebrating as it always does: with the Academic Performance Tournament, a bracket based not on athletic prowess but on a team’s academic success, as measured by the NCAA’s academic progress rate (APR). (Our bracket for the men’s tournament can be found here.)
The metric is far from perfect; among other things, it does not include athletes who leave the program in good academic standing, so powerhouse programs that players depart to go pro early can still fare well on the measure. We used data from 2021–2022, the most recent available.
For institutions that tie—and there are quite a lot of them in this bracket, especially among teams that achieved perfect 1000 APRs—we use the NCAA’s graduation success rate (GSR) for 2022–23, which measures the proportion of athletes who graduated within six years of entering an institution. It, too, excludes athletes who left the program in good academic standing. For teams with the exact same academic progress rate and graduation success rate, we utilized teams’ federal graduation rate (FGR), the formula the federal government uses to track graduation rates for all students, which tends to skew lower than the NCAA’s metric.
As of publication, a handful of seeds still had not been determined but based on academic progress rates, Columbia University, College of the Holy Cross, Sacred Heart University and the University of Arizona each earn spots in the tournament over their competitors.
This year, we encountered something we had never before seen in our Academic Performance Tournament—at least as far as Inside Higher Ed co-founder Doug Lederman, who has overseen the tournament since its birth, can recall. Two teams with the exact same APR, GPR and FGR metrics, Creighton University in Nebraska and Drake University in Iowa, were matched up against one another in the Final Four. We decided to use the overall GSR score across the universities’ NCAA teams to determine a winner, and Creighton came out ahead by just 3 percentage points.
We also had to contend with the inclusion of two Ivy League universities, Columbia and Princeton, which do not report FGRs because they don’t give out athletic scholarships. Both institutions came to a double-tiebreaker, with the University of Michigan and Holy Cross, so we again used overall GSRs to break the tie. Columbia beat out Michigan, but Princeton and Holy Cross were perfectly matched, each with an overall GSR of 98. So, things came down to a coin flip, which Holy Cross won.
That lack of FGR data for the Ivies may have played a pivotal role in the outcome of the bracket, which you can view below. But there is no doubt that it would have been tough for anyone to beat the winner, which boasts a perfect APR of 1000, a perfect team GSR of 100 and an overall GSR of 99.

Congratulations, Lions!


.jpg?itok=qKqjsf3G)

